Written Paper Section I Question 25-27 from the 2001 HSC Examination
Question 25-27
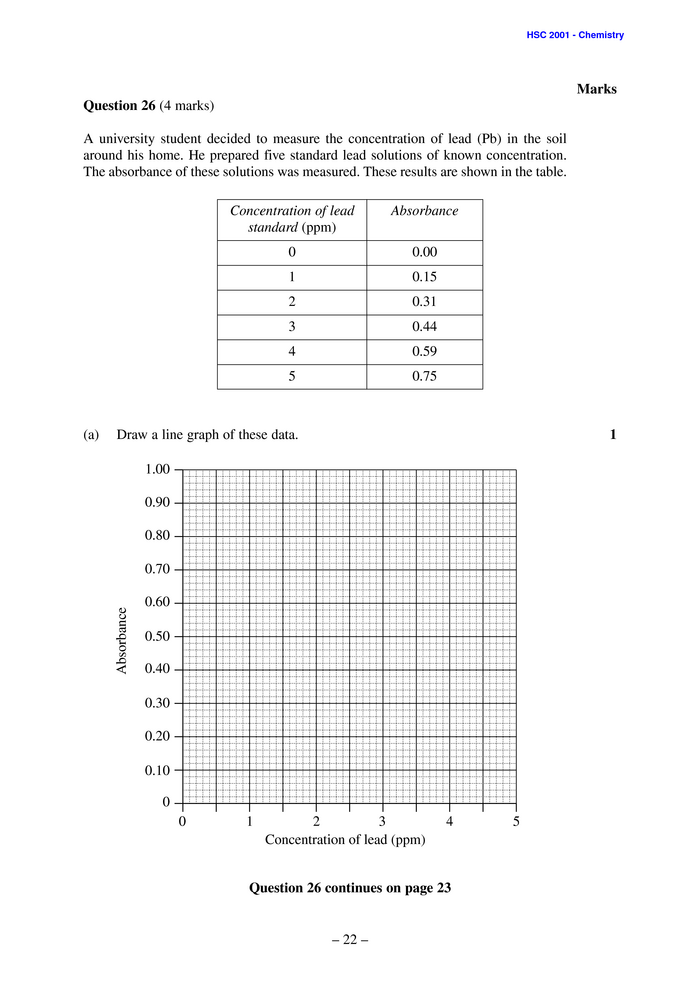
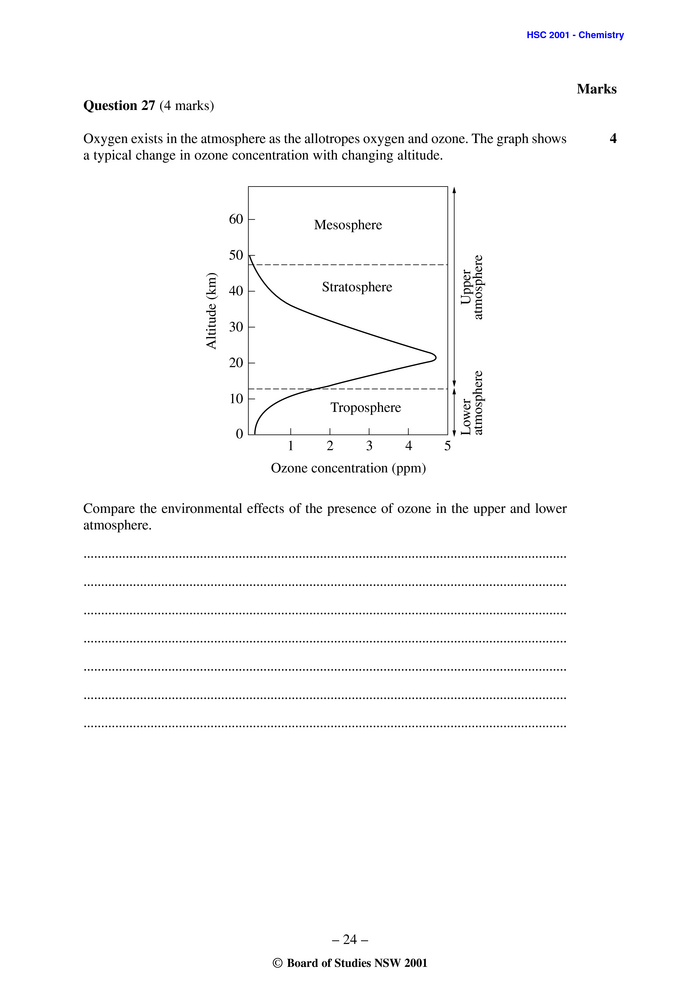
Summary: 25. Explain the need for monitoring the products of a chemical reaction such as combustion. 26(a) Draw a graph using a fixed scale and data about lead concentrations. (b) Use the graph to interpret data. (c) State an hypothesis to account for variation in lead concentration observed. 27. Use a graph showing how ozone concentration changes with altitude to compare the environmental effects of the presence of ozone in the upper and lower atmosphere.